Cat Reith: Hello, and welcome to the webinar. We are going to give folks just two more minutes to settle in, but while we wait, I just have a couple of quick housekeeping notes. First, this presentation is going to be recorded, so we’re going to send the recording out to all registrants. Both the recording and the transcript will be posted on our website following the session as well. Second, if you haven’t registered for the Partner Success Portal yet, you can go ahead and request access now, our team is standing by to help. But don’t worry, you can sit back, relax, watch, you can log in later if you prefer. And last note, today’s content is intended for registered attendees only. It’s not meant for media distribution or public sharing, so just keep that in mind, please. And thanks again for joining us. We are going to start in just a moment.
All right, looks like attendees have slowed down. We can go ahead and get started. To kick us off, I’d like to introduce Angie Briggs, Senior Vice President of Industry Partnerships and Engagement. Hi, Angie!
Angie Briggs: Good day, everyone, and welcome. Thank you for taking the time to join us today. We know your schedules are full, and the fact that you’re here tells us you value these resources, so we appreciate that. You’ll be hearing from a number of our team members that have really owned and led all the changes and enhancements that we’re going to showcase in our time together today.
We have three objectives for today’s session. First, we’ll walk you through our newly launched corporate website. Second, we’ll showcase some new features we’ve added to the Partner Success Portal. And then we’ll round it out by taking a deeper dive into the Research Hub that lives inside the Partner Success Portal.
I want to take a moment on why that matters so much. Across both the corporate site and the Partner Portal, we’re putting some of our most valuable resources directly in your hands. Research and insights that go well beyond a nice-to-have. The economic development data we produce collectively helps you tell the story of what international marketing achieves, both for the industry broadly, but probably more importantly for your own organization. It gives us what you need to not only defend your own organization, your budget, and your future investments. But it doesn’t stop here. We also provide global market intelligence, everything from airline data to market trends, and even monthly traveler sentiment insights that can directly inform and drive your marketing decisions.
So, our hope for today is simple, that you leave with a clear sense of what’s available to you, where to find it, and how to put it to good use. So let’s get started. I’ll turn it over to Dan Rosenbaum, our Senior Director of Digital Marketing. Dan?
Dan Rosenbaum: Thanks, Angie! I’m really, really excited to go over the new corporate site. Before I show you anything, I just want to level set here, and explain what we set out to build. And that is a living hub of information and connectivity. Two words for what we did: it was rebuilt and reorganized. Rebuilt on a new platform, new design, new architecture. But also, importantly, it was reorganized. Everything lives somewhere where you actually look for it. So why does this matter?
In our previous site, our impact story, and yours, lived in a PDF three levels down. So the fix really isn’t about decoration. Whoever you are — a partner, a journalist, a Hill staffer — you find what you came for, and you can take it with you. So here is why we rebuilt it.
To be completely honest, this was the first comprehensive look at this site in 10 years. Many of you on this call will realize that 10 years in internet time is a very long time, basically eternity. And we started with research. We fielded a survey, and 100 partners responded. Some of you on this call actually filled it out. And that survey and the results were a direct result of what we built the site around.
The news back was good. We found out the site was credible, navigable, to those who knew where to find things. Three and four already were using it for real business decisions, whether that’s pitching a board, briefing your stakeholders, or even deciding whether to contribute to a program.
That same survey, though, told us where we could go further. Deeper insights, not just headlines — we wanted to give you easier access to resources, and ultimately, we wanted a site that keeps pace with how you, our partners, work today. And the loudest signal in the whole survey, which Angie just mentioned, is you need resources to make the case at home. It’s not our case, but it’s yours. You need to explain why international travel matters to your destination in a form you can hand out to your stakeholders without building it from scratch.
That’s the reason, really, why we built this site, and you’ll see it in many different forms throughout. We also ran internal discovery meetings across every department. The survey plus those sessions shaped the website strategy, the information architecture, and how the whole site is organized. Those six objectives — strategic storytelling, improved user experience, future-ready platform, creating more stakeholder value, and of course showing industry leadership, as well as an integrated digital ecosystem — all came out of that work.
Which brings me to who was actually in the room. So, I want to be clear here: this was an all-hands-on-deck effort. Eight teams shaped the site. Every one of them sat in discovery meetings, reviewed the wireframes, and reviewed content migration for their own sections. The slide has the full list. But — and I won’t read it to you — what this does mean for you is the information on the site comes from the teams who own the work. Not just from one team summarizing it. Your state fact sheets were reviewed by the people who are educating our stakeholders on the impact of international tourism, the program pages reviewed by our partner team.
So, here’s how long it took. Most of you on this call have probably gone through a website redesign and launch before, so you know exactly what’s sitting behind this timeline. And I’ll summarize it with this: 11 months, from September 2025 to our launch in August, on August 24th. We went about being really intentional with how we got here, and 11 months should show you how important of a project this was, and a priority for us.
So, that’s the how. Here’s the real part that matters to all of you. So, five things. Number one, the impact material is built to be lifted and discoverable. Economic impact figures, the ROI study, state-by-state fact sheets together in one place. Built to be downloaded, cited, and shared. And my hope is that you see it as a web page and not a PDF hunt.
Two is understand the program before you commit to it. Every program is in a filterable list, plus a getting-started path, where you learn how partnering works, who to contact — and if you’ve ever forwarded a program PDF and spent 20 minutes explaining it, that’s hopefully a problem we hope to solve.
Number three, AI education has a home. Webinars, recordings, articles, trainings — it’s all in one place instead of scattered across LinkedIn and event listings.
Number four is one calendar. One calendar that shows roadshows, sales missions, webinars, board meetings, and you’ll see it across our site in many different places, but it’s one calendar, filtered by type and by date, and by default, depending on where it is on the site.
And number five is the site itself — the site, the portal, and Brand USA Travel Week are all connected, so moving between them is a handoff. So if I compressed all five into one line, it’s: the old site was built for us to publish to. This new site is built for you to take things from. So, let me show you the site now.
So, I’m going to go through 5 pre-recorded videos of the site. Of course, you can go on the site yourself and look at it. These were recorded a couple of days ago, but there have been some changes on the site, so please feel free to go and explore it yourself. We’ll touch on the homepage, state fact sheets, programs, events, AI and innovation, as well as research. These are only subsets of some of the sections of the site, so I encourage you to explore more.
First up, we’ll go through the homepage. The old homepage said one word: welcome. Now it says, supporting American businesses, jobs, and communities through international traveler. That’s who we are, and who we do it for. Right under that are four buttons: programs and innovation, events, state fact sheets — the four things you probably came here for before you scroll. And then if you watch that band, those are the impact numbers I talked about. Right up front, not buried, and every one of those figures is a number you can use.
Now, here’s our work in action: American the Beautiful, American Originals, Travel With Confidence. This is where you can see what we’re putting out into the market on your behalf. And of course, explore Brand USA at the bottom — programs, insights, what’s new, travel week. The whole page is built to route you, not to make you read.
So the next stop is state fact sheets, and something that I want you to remember. Every state and territory has a real web page here. It used to be 50 PDFs in an alphabetical list. You go to that page, type in your state — watch here, KEN — and there’s Kentucky. That’s the whole interaction, and here’s what you get on a page: you get jobs supported, travel spending, tax receipts, and much, much more. Those aren’t just numbers, those are your state’s numbers.
Here you get to see voices from the field, partners in your state in their own words, then cooperative marketing, more numbers here, and then you get a list of who we partner in your state. For Kentucky, that’s 10 organizations, named — that’s where we name them down to the destinations. And then, of course, you get to see more videos, more deep, rich content about how international travel is fueling your destination.
From here, you can see destination immersions by market and year — Canada into Louisville in 2024, UK and Ireland into Bowling Green, Lexington, and more in 2025. That’s really the granularity about your state, your partners, and markets. And most of you are heading into a sit-down to defend international marketing budgets, and this page right here is something that you can take to that stakeholder, so that you have your case already built.
Now, next up is programs. This is really important when we thought about this section. We start where a new partner would start — getting started with Brand USA. Of course, there are other programs that are geared towards different parts of the funnel, but getting started really is about showcasing how partnership works with Brand USA. Four steps: contribute, collaborate, launch, and measure. And it answers questions that we get from the top.
Now onto the programs themselves. Here are current programs. On the old site, this was a wall of text sorted by deadlines. Now it’s all markets, all categories, names, markets, deadlines, in one view. And as you can see at a glance, what’s closed, what’s still open — and that’s what this whole view is for. So we’re going to open up one, and this is where it gets even more useful: key dates in the sidebar, open status, start date, participation deadline, material deadlines, markets it covers, and of course, a PDF. And then the actual campaign, our actual program products and everything. And of course, here’s where you can click to get the PDF as a takeaway.
So again, this is really seamless — it showcases what you have to offer, and the PDF is still available as a takeaway. Now, if you go down the page, you’re going to see a little bit more frequently asked questions, a little more granular than at the top. This is across all of the different Partner Program pages. And really, below that is impact — what these programs do for destinations — as well as, further down, more testimonials, more pull quotes from partners talking about the positive nature of the programs.
So, next up are events. What I want to stress here is there’s one calendar for everything that Brand USA does — roadshows, sales missions, webinars, board meetings — again filtered by type and by date. You open one here — here’s the Mexico sales mission — you learn about the event itself. You can register right there, you can add it to the calendar, you see other upcoming events in the series, you see related events. Click here, you can see New Zealand Expo — again, more information. Each event connects to each other, so that one event becomes a door to the next one.
And now watch this: this is Travel Week. It has its own section on the site and a calendar that takes you straight there. Here you get to see the value proposition of Brand USA Travel Week — that it’s a series, that we cover four different markets. And then you click into Travel Week India 2027, and here you get to see specific information about that event, but you don’t have to move outside to get other events in the series. And of course, there’s a handoff there to the actual event website.
So, the last thing here that I want to show, after we go through this slider that you see — it’s a place for us to show off what that event really looks like, and I think it’s really important to show the human side of these events, and what goes on there.
So, if we go to the last event section, that’s webinars and presentations. This is really great. We not only show upcoming webinars, but if you go into past webinars, you’ll notice the page itself doesn’t go stale, it doesn’t disappear — it becomes the resource. Here, Agents of Change from August, with the full recording transcript embedded, along with the video and the PDF of the deck. It’s right there on the page, which means that this webinar — the one you’re sitting in right now — will be on that page, recording and slides, and it’s something that you can then use as a resource and share with a colleague who couldn’t make this call.
All right, last stop is insights, research, and of course AI. First and foremost, the research. We have Market Insights on the corporate site. It’s not hidden in a PDF. You’ll learn here how travelers learn about the U.S., impressions of the U.S., trip activities — all of this. This is just the surface. Jonas will go over what’s behind the Partner Success Portal — we have a deeper research layer there, which Jonas will walk through later in the call.
And then we’ll go to the second part here, and that’s the AI work. Jeanette has really been leading this, and it’s been living across LinkedIn and conference stages, and it has a home now on the Brand USA corporate site. It’s articles — here’s the shape of the personal OS for Claude — it’s practical, it’s not theoretical, it’s a guide, it’s a resource. And they’re all connected together below. So as Jeanette publishes more content around AI, this will be on the Hub. And as you can see, the Agents of Change series has recordings of what’s passed, but obviously what’s to come as well — here’s AI for Small Tourism Businesses on September 10th.
Okay, so that’s really the tour here, and I really encourage all of you to go ahead and explore the site yourselves. And so this is my last slide, and really the one ask is that you go to thebrandusa.com, find your state, check out the page, get the PDF, and really look at how we see the impact of international tourism, not only for the U.S., but down to your destination.
And so, I think it’s really important here, after the state fact sheets, to look at your next program, and then finally the Partner Success Portal, which is on top of every page on the site. And with that, I’ll pass it on to Carolyn, who’s going to go over the exciting new things about the Partner Success Portal.
Carolyn Qualls: Thank you so much, Dan, that’s great information. At this time, we’d like to encourage you to log into the Partner Success Portal at portal.thebrandusa.com, and follow along live with us so you can try things as you go, instead of just watching the demo.
So just to take a trip down memory lane, when we first developed the Partner Success Portal, the vision was to create a best-in-class resource center where you can understand your relationship with Brand USA as comprehensively as possible. The goal is to give you one place to go for key resources, campaign activity, reporting, and metrics, and ways to engage with us.
Just a reminder of who can access the Partner Success Portal: it’s designed for U.S.-based DMOs — cities, states, territories, regions — as well as corporations and attractions that own and sell their own travel products and engage with Brand USA. Partners can also provide access to their designated agencies or representatives. If you haven’t logged in yet, you can request access directly from the login screen, and our team will be available to help during the webinar.
So where did we start? One of our North Stars was to put campaign metrics at partners’ fingertips by automatically aggregating results in one place. This eliminates the need to manually piece together numbers from separate campaign reports.
Alongside campaign metrics, partners needed a clear view of what’s live, in which markets, and what actions are coming next. The campaign view brings that information together in one place, so the portal becomes a working tool, not just a place to look up data.
We also wanted to make final campaign reports easier to find. As reports are completed, they can be accessed through the campaign page, creating a consistent place to find reporting without having to dig through emails or folders.
So, fiscal 28 was a big year for the Partner Success Portal, with a number of new features and updates, including trade activity, USA Discovery Program, content details, organization and contact management, expanded campaign metrics, an updated homepage, and the new message center. And we’re continuing to build from there. The portal continues to evolve as more information and activity are brought together in one place.
If you haven’t done so already, this is the time to log into the Partner Success Portal and follow along. If there are any issues accessing the Portal, our team is available in the Q&A to help in real time. And with that, I’ll turn it over to Kat to walk through these new features.
Cat Reith: Thank you so much, Carolyn. It’s good to see you. Well, we are so excited to share the new features that we’ve added to the Partner Success Portal. Before we get to the new homepage, I just want to highlight a few basic enhancements to places that you’re probably already familiar with, as well as some new features that we launched earlier this year.
So, first, on the upper left is Campaigns. Campaigns and analytics are largely the same, but we have updated the campaign list views to make key information, like material due dates, even clearer, so that this is really actionable for you. We also added metrics from additional programs, so things like affinity campaigns are now listed there, so if you didn’t notice that before, you can go check that out.
We’ve also added 3 wholly new sections. First, trade activity — if you or anyone at your organization attended an event with Brand USA, like travel week, a sales mission, or a roadshow, anyone at your organization, it’s going to show up here. It’s also going to have the recap link, so that little link on the right-hand side, so you’ll be able to view the report of that event.
Second, content — if the program you participated in had an output, like a video or a page on VisitTheUSA.com, you can access that directly from the portal instead of having to track it down through your reports. That was something that came to us, and we were like, that’s a really good idea, so we added that.
And the last thing we added in the last couple months is metrics from the USA Discovery Program. So if your organization has a live badge on the USA Discovery Program, you can view all of the starts and completes right in the Partner Success Portal, and it’s updated monthly, so you’ll see everything from the past month updated.
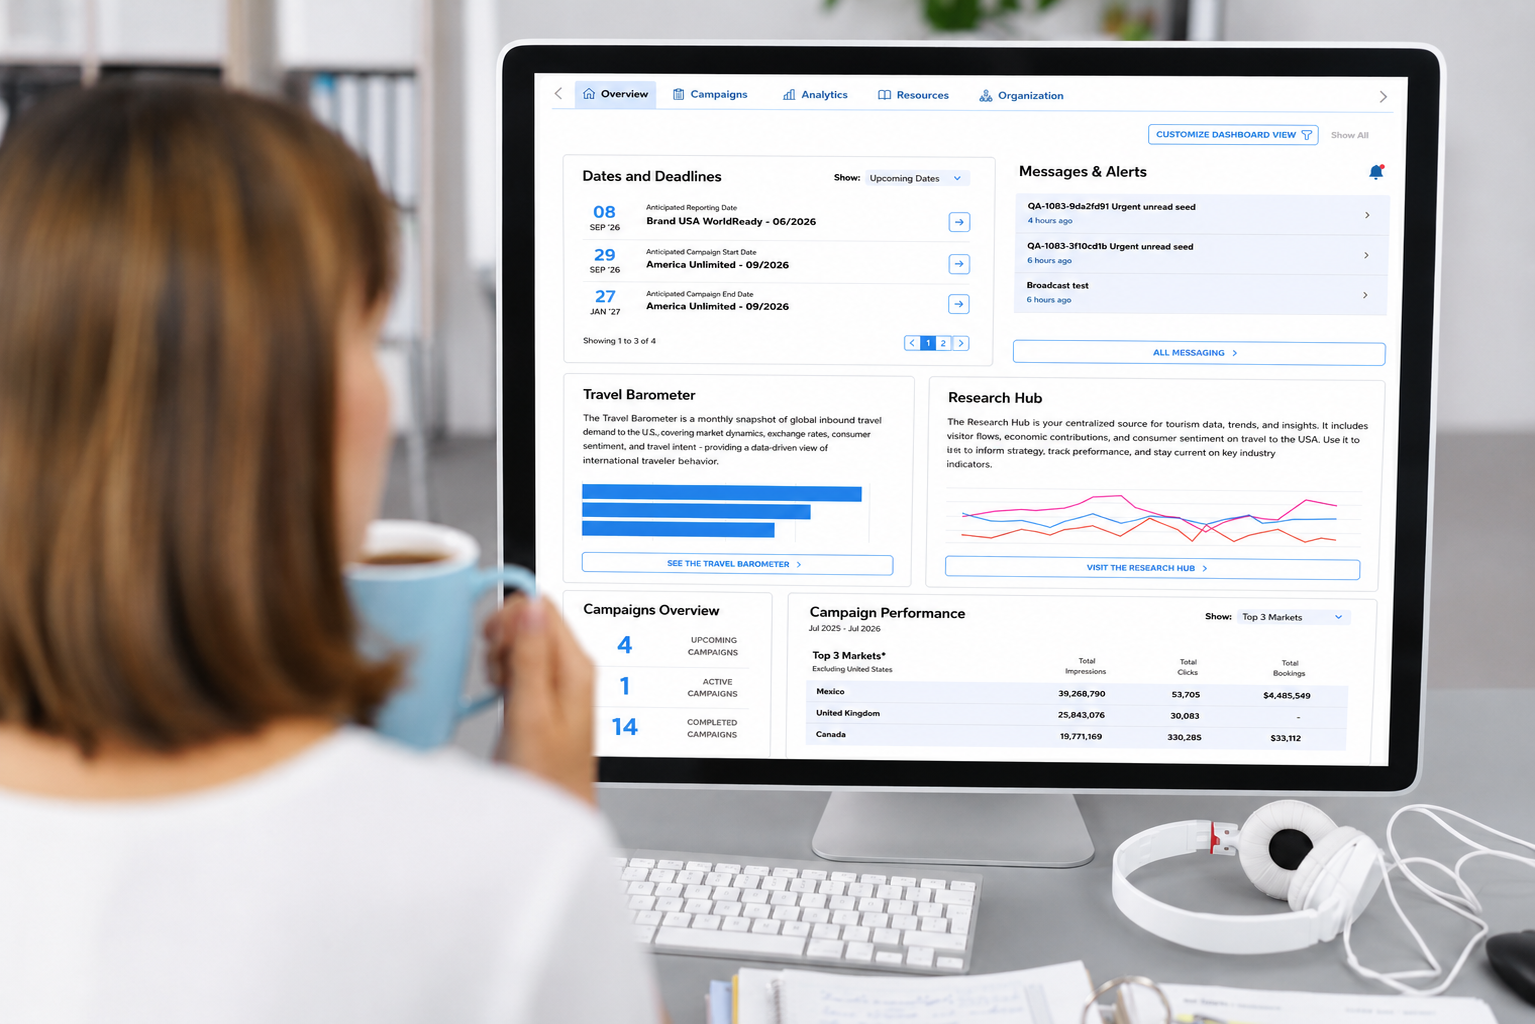
So, with that, that’s everything we did a couple months ago. We’re really excited to share the new stuff, though — this all happened within two weeks. If you haven’t seen it, log in, check it out for yourself. This is our new homepage.
First, a big thank you to our partners — your input helped us develop this to make sure that we’re bringing relevant content to you, right up front. So, up at the top, we still have the dates and deadlines. We know that’s important. We also have a new message center, which we’ll go into a little more later. We also put the travel barometer and the research hub up front, just because we know that’s really important to you all.
We also wanted to elevate campaign information and campaign performance metrics. We know that’s hugely important for you and a lot of your stakeholders, so we wanted to make sure that was up front and center. We also wanted to elevate VisitTheUSA.com analytics — we highlight everyone on our webpage, and so we wanted to make those metrics available to everyone.
We also added trade activity and USA Discovery Program information right on the homepage. There’s also ways to customize this, as well — so all that information is there for you. Please go check it out, and thank you again for all of the feedback. That’s how it got here.
So, the next area we wanted to share with you is the Message Center. Up at the top of the screen, you’ll see messages — there’s a little red dot next to it, or you can see the little messages and alert widget. When you click into there, you’ll be taken to the message center, which is something else we heard from our partners — that you really wanted a centralized place for all things Brand USA, and this is another way that we can communicate with you beyond emails, calls, and all the other ways that we communicate with you.
You will still see all of the important things about your campaign, like a new report has posted, or you have a materials deadline coming up, but you’ll also see things like Brand USA press releases that we think are relevant for you. You’ll also see deadlines coming up for things like an optimized audience campaign — the one Dan was showing earlier for Mexico, the deadline is November 6th — you’ll see that in there.
So we’re just trying to make it really clean and easy, and keep it a one-stop shop for you with the message center, so please do keep an eye on it, especially if you visit the Portal regularly — hopefully you’re seeing some really relevant content pop up for you. The other thing on here is calls for content. Our information is only as good as the information we can get from you, because you all own that great material. So we’re often asking for things like winter content, Olympic content — right from the Message Center, you can click through and submit your content to us, and know that it’s getting to the right place as quickly as possible. So, that’s everything in the Message Center, and we’re very excited about it. Nothing for you to do — you don’t have to respond to anything in there, it’s just a way for us to communicate with you.
So, the next and last area I’m going to show you is the organization area. If you click on organization, there are 3 tabs: Organization Details, Contacts, and Market Interest. The first tab, Organization Details, includes things like your address, your phone number, all of that. We know those things can change — this way, if you update it here, you’ll know that Brand USA is aware of the change. That’s helpful for both of us to know. We also know that our fiscal year doesn’t always match your fiscal year, but since we have timely conversations about program participation and things like that, knowing when your fiscal year starts is super helpful — so please log in and update that. That gives us more information so we can make sure we’re having good, timely conversations with you.
Down at the bottom, if you scroll down, there’s an area specifically for socials. Our team is always marketing, so we always have things going out on TikTok and Facebook, and we want to make sure we’re using your most relevant handles, hashtags, all the things. So please go in and update this, because it’s going to allow our team to do a better job of using the correct information you’ve provided. So, you filling that in would be incredibly helpful, and hopefully also beneficial to you as we do marketing on your behalf.
So that’s everything on the account area. I’ll pause to say some of these areas may not be available to you — it depends on the level of access you have, so if you don’t see these things, that’s okay, just know someone at your organization has access.
Contacts — when you click on this, you’re probably seeing a large number, or maybe just a small number of contacts. These are just the contacts that Brand USA is aware of at your organization, in our systems. It’s not a full list of anyone who has access to the Partner Success Portal — it’s kind of everyone, right? So this is where you can keep us up to date on changes — maybe someone got promoted and has a new title, maybe someone has moved on and is no longer there. This is your way of telling us that right away through the Partner Success Portal. You can also add or remove access to the Partner Success Portal here, and add new members of your team, too, which is really helpful.
The other call-out I wanted to make is market responsibility. We often have a lot of information to share with you, and sometimes it’s very relevant to a particular market. We want to know who on your team is responsible for those markets — we don’t want to be sending lots of information to irrelevant folks. If you don’t work in Mexico, you don’t need that email or invitation. So, market responsibility is a way for you to update us on who handles what market, which helps your inboxes, basically, and helps us understand who to better communicate with about relevant content specifically for those markets.
Also, at the bottom, you can see agency contacts. As Carolyn mentioned earlier, you can add in your agency contacts — it doesn’t necessarily mean you’re giving them access to the Partner Success Portal, though you can do that. It’s more about letting Brand USA know who you’re working with, because that gives us a better understanding of your reach across the world, and it just gives us more information, which is always better and allows us to be better communicators for you.
So that is everything on the contact page. The last one is market interest. We often ask you where you’re active, and where you’re interested in maybe growing your international marketing. Now you can do that right in the Partner Success Portal, and it goes right into our system, so we’ll always have it. So essentially, in the example, you’ll see they’re saying they’re active in Australia and Brazil, and it’s going to show up in this little tab for active markets. You can then fill in a couple of little questions — are you active in the sense of trade? Do you have trade representation there, or PR representation? Are you doing actual consumer marketing there? These things are just going to help us better communicate with you and give you better information.
So, keeping this up to date is really helpful, especially as we plan for future fiscal years and plan out our programming — knowing where you’re interested will help us make sure we’re providing relevant and important programming for your needs. And for interested markets, the only two questions are: are you interested in trade events, or are you interested in programming? Very simple — maybe you’re not active there, but you’re curious, so that gives us insight into what you might need in the future.
So that is everything we wanted to do a deep dive on in the Partner Success Portal. I am actually going to encourage you, if you’re in the Portal right now, go ahead and click the homepage and click Visit the Research Hub, and I will pass it over to Jonas, our Director of Research and Insights, for a walkthrough of the Research Hub. Hi, Jonas!
Jonas Onkelinx: Thank you, Kat. Good afternoon, everyone, or good morning to some of you. It’s my pleasure to, before we get to the Q&A, already give you some answers and insights. We developed a research hub as part of the Partner Success Portal to help you get some insights at the market level.
I’ll dive right in. So, when you log in, this is what you get — an overview page with all the different subsections, and when you scroll down, you get a very brief description of each of these. The first section is U.S. inbound travel. This, of course, is very relevant to all of you. It gives an overview of year-to-date visitation, and you can also click through to historical data patterns. What we see is year-to-date visitation through May, because we have the most recent data, including Canada and Mexico, for that period. There are several pages, so you can look at all the different markets. There’s a brief note here showing overseas arrivals — they’re down 5% through July. So for overseas, we do have more recent data — this was updated mid-August, so very recent, it’s the latest data, and you can also download this graph if you like.
When you go to the historical data, you have more data, both historically, but also, there’s more recent data available. If you look at 25 and 26, for instance, you’ll see that the data updates to get into the monthly detail, and if you then select an overseas market where we do have data through July, you get more recent data. So in this example, we’ll show you visitation for Norway, and you can see that in June of 2026, we had a big increase in arrivals from Norway, thanks to the World Cup, of course. We’ve seen those fans all across the United States. So, if you look at the historical data, you can get to more recent data here.
The next section shows you state inbound travel, so here we look at the top 5 inbound markets by state. By default, it takes you to the national rankings — Mexico, Canada, the UK, India, Brazil, are the top 5 markets — but when you select the state-level data, it will show your individual state and how its top 5 markets compare to the national average. So, Alabama’s, of course, first alphabetically, and their markets are Canada, the UK, Japan, India, and Germany for the top 5. There’s also, if you look at other markets, like Asia-Pacific-focused markets like Hawaii, you’ll see that this ranking is very different. Japan is their number one for Hawaii. The national market share is just 2%, but 1 in 3 visitors to Hawaii come from Japan.
When we look at air capacity, we show you year-to-date air capacity. You can look at it by total number of non-stop inbound seats, or by number of flights. We have more than 100 markets that have non-stop flights to the U.S., so 10 pages here, and you can drill down. So South Korea, for instance, you can see that almost 3 million seats, and Guam is their number 3 destination at the state level, where we do include all of the territories.
Next is a section many of you are familiar with, our travel barometer. Here, we summarize the latest trends in visitation, we look at economic factors, exchange rates, air capacity, but this is also the section where you can find our consumer sentiment. So that’s a section of our research that’s only available here in the Travel Barometer. So if you want to get the latest on consumer sentiment, this is the place to go.
And then finally, our market intelligence. Dan already showed that this is also available on our corporate website. In the Research Hub, it allows you to dig a little bit deeper. We do have historical data here as well, so you can select 2024 or 25, and when you get to the market level, you’ll see here on the right that it does compare the market versus the overall average. So it’s slightly different from what we have on the corporate website — it gets a little bit more granular. You get a lot of insights on each of these markets, you can download all of the visuals, you get insights on who is traveling, where they plan to go, how long they intend to stay, how they plan their trip, which kind of media they use, when they start planning — so that’s, of course, very relevant for all of you, the different resources they use, online sources, including a list of all the social media channels that are the preferred channels for each of these markets.
And then, of course, the attributes of the United States, where you can, again, compare the market average versus the average of all markets. Trip activities, what they’d like to do in the United States, and of course, their preferred destinations, both at how many cities they plan to visit, but also all of the different states and territories.
That’s it for the Research Hub, and let’s take it to the Q&A now.
Cat Reith: Awesome, thank you so much. So, we do have a couple questions. I’m just going to start at the top. So I think this is for Dan: do the state fact sheets only show state-level numbers, or can I see what’s happening in my individual destinations?
Dan Rosenbaum: You know, Kat, that’s a great question, I’m glad someone asked that. So roughly, the city-level granularity is — this is how it flows down. The state-level numbers at the top of the page are specifically for the state, but if you scroll down, it gets a little bit more specific for your destination. It talks about all the partners that Brand USA partners with, down below, and then Destination Immersions breaks out by market. But on certain pages where there are actually pull quotes and testimonials, that’s taken directly from the partner itself.
So, on the Kentucky page, there’s Louisville, so there are a lot of places here where we can get to the city level on a state fact sheet, and the partner list and destination sections are just the start of it, along with voices from the field. We are looking to expand these state fact sheets to include content that Brand USA creates, that Kat mentioned, whether it’s on social or American Originals, but that’s further down the line. So for right now, the granularity sits within those sections — the partner list, the destination immersions, as well as any existing video and testimonials.
Cat Reith: Awesome! Thank you so much, Dan. There’s another question: what are VisitTheUSA.com analytics? That’s a really good question. So, within the Partner Success Portal, we have VisitTheUSA.com, and our partners are featured on those pages, right? So we wanted to elevate the results, or the metrics, from those pages on the site for you to see. So, for example, if there was a business that was highlighted in an itinerary page, for example, that would show up for you if it’s in your city, if it’s in your state. So, that’s what we mean when we say VisitTheUSA.com analytics — it’s all the basic analytics that you would get from website metrics. So, if you haven’t clicked over there, please go ahead and take a peek. So that is the answer to that one.
Let me see, we have another one for the research hub: how frequently is the data updated? I think that’s for Jonas.
Jonas Onkelinx: Sure, great question. It’s updated constantly — really, depending on which of the sections you’re looking at, it depends. Many of the sources are updated monthly, like the barometer. Of course, our market intelligence is only an annual study that we do, but all of the other sections — airlift, visitation — those are scraped constantly at the source data provider or the airline data provider that we use. So whenever there’s new data available, it’s live immediately.
Cat Reith: Perfect. Okay, just checking through here — I see another one. Kat and Carolyn both said that reports are available in the PSP: what reports do you mean, and where would I find them? So, if you ever participate in programming with Brand USA, we always provide a full report of that campaign, and so, within the PSP — the Partner Success Portal — if you click Campaigns, and you click into one of the completed campaigns, there should be a button up at the top that is very clear, it says “report,” so if you click on that, you’ll be able to see the report of that particular campaign. If it’s not completed yet, that’s okay, it’s not going to show up yet, but that’s where you would see it. If you don’t see the campaigns tab, that’s also okay — it probably just means that your organization hasn’t formally done a program with Brand USA, and if you have questions about that, please reach out to your Partner Engagement Representative, or send a note to PartnerInfo at thebrandusa.com to connect with us, and we’re happy to talk to you about what program options we have and give you some examples of what we mean by reports for those campaigns.
Let’s see here — checking any other — we have a question about airlift numbers: are you considering point of origin outside of the USA, so we don’t accidentally count locals coming back from vacation? I think that’s a question for Jonas.
Jonas Onkelinx: Sure, I’ll take that one. Yeah, so for the airlift numbers, we look at nonstop seat capacity and number of flights, so that really talks about how many planes are flying from foreign markets to the United States — nonstop flights from a foreign origin airport to a U.S. destination, including the territories. If you’re talking about the visitation numbers, so the year-to-date arrivals, those are tourist arrivals — those are based on country of residence, really where these people live, regardless of their passport — foreign nationals flying to the U.S. or arriving by sea, and staying at least one night in the United States. So tourist arrivals are really based on country of residence. When we talk about air capacity, airlift, it’s really talking about numbers of seats on planes — so regardless of who flies, could be Americans, could be foreign nationals, could be people connecting in those markets, it’s really the capacity. It could also be empty seats on some planes.
Cat Reith: That makes sense. Thank you so much, Jonas. We also see a couple of questions that are very specific to your needs for the Partner Success Portal — we’re going to reach out to you directly, because we want to make sure that we work with you individually to make sure that it’s all working the way you expect. So bear with us, we won’t answer those live, we’ll just reach out to you directly. So either your Partner Engagement Representative will be in touch, maybe I’ll be in touch. We’ll see — someone will be in touch to make sure you have access, no problem at all.
Let’s see, we do have two other questions — please keep them coming. Let’s see, for content corrections on sheets, I’ll pass that over to Dan: how do we correct content on state fact sheets?
Dan Rosenbaum: Yes, this is a great question. There are a couple of avenues to do so. One would be — I would encourage you to use the forms on our website. Those forms get directly fed to the team and directed to the right people. With state fact sheets, not only do we update the website, but we’ll update the PDF as well. The other avenue, of course, is if you have a relationship with your Partner Engagement person, you can reach out to them directly as well. So those are the two, but I would say the fastest and the easiest way is to go through our forms on our website to ask for any corrections.
Cat Reith: Perfect. I think we have hit all of the questions that are not technical questions. Unless there’s anyone else, does anyone else have a question?
All right. Well, thank you everyone for coming today. We really appreciate it. We really couldn’t do any of this work without our partners, so a big, big thank you to everybody, and hopefully we will see you very, very soon. Thanks to all the speakers as well. See you all later!